Pages

Friday, May 28, 2010

Barry Eichengreen Sees a Breakup of the Dollar Zone

Over at The Economist there is an interesting discussion surrounding the future of the Eurozone. Today Barry Eichengreen weighed in and made the case that the dollar zone in the United States will break up in the next 10 years due to state fiscal problems. Coming from Eichengreen, this piece has to be satire. There is no way he really believes the dollar zone will breakup in the next decade. Even I don't believe it and I have published research questioning whether the United States is truly an optimal currency area. I suspect Eichengreen is cleverly making the point that even though there may be problems with the dollar zone, that if taken to their logical conclusion would imply a break up of currency union, it is absurd to think it will actually happen. If so, then ditto for the break up of the Eurozone. Or maybe I am reading too much into this piece. Maybe the Eurozone crisis has Eichengreen in a funk and he has taken to heart the conversation among Paul Krugman, Ryan Avent, and myself that questioned the dollar zone as an optimal currency area. You decide for yourself:
[T]he dollar area will fragment over the next ten years.

Recent events have made it clear that the idea of monetary union is deeply flawed. Economic specialists have long pointed to the contradictions, but politicians pushed ahead for essentially non-economic reasons. We are now paying the price.

The coexistence of a single currency and a single central bank with a set of separate state budgets is a fundamental contradiction. The union lacks a mechanism for adequately co-ordinating those budgets. The result is the unseemly spectacle of some states (California, Nevada) chronically overspending while others (West Virginia, Wyoming) live within their means. Often the deficit states are the ones with high unemployment rates and serious competitiveness problems.

This unsustainable state of affairs has multiple causes, but it has been aggravated by the existence of a single currency. Without the risk of exchange-rate changes, the member states share a common level of interest rates, making it easier for the profligate to live beyond their means. So long as investors remain somnolent, the less disciplined member states are encouraged to throw "one big fat Greek party". When they finally awake to the fact that government finances are unsustainable, all hell breaks loose.

[...]

Creating a monetary union of the 50 American states was a mistake. The dollar area is sure to fragment in the next ten years.

Read the rest here.

Enertaining Look at the Eurozone Crisis

Ryan Avent points us to this brief but entertaining discussion on the Eurozone crisis:

Thursday, May 27, 2010

About That 'Long Depression' of the 1870s

Over at Angry Bear, Spencer asks a question:
[W]hat about the recent argument by Bryan Caplan... that the decade of 1870's was the peak for Libertarian freedom and economics[?] Maybe, but I wonder if he is even aware that economic historians label the 1870's as the "Long Depression". I find it really amusing that he so proud of what others call a depression.
I cannot speak to the historical peak of the libertarian movement, but I do want to address the claim that "economic historians label the 1870's as the Long Depression." That may have been the case in the past, but recent scholarship completely refutes this notion. According to a number of studies there simply is no evidence for a prolonged recession in the 1870s. I have covered this issue before and have the reposted that discussion below. Before turning to this discussion let me point out that Joseph H. Davis in his Journal of Economic History paper notes that the cycle dates set by the NBER in 19th century, which do show a prolonged recession in the 1870s, are flawed because they relied heavily on (1) qualitative information which tended to notice downturns more than upturns and on (2) nominal measures rather than real ones. Therefore, the NBER cycle dates for the 19th century are not reliable. Now here is my previous discussion:
About that Great Recession of 1873...it did not last until 1879 and it is not the longest U.S. economic contraction on record. One would not know this, though, by looking at the NBER's business cycle dates. These dates show this economic downturn lasted a record 65 months from October 1873 through May 1879. Therefore, it is understandable why observers like Paul Krugman, Matthew Yglesias, and Robert Shiller continue to invoke this period in their discussions of the current economic crisis. These dates, however, are wrong according to a series of papers published by Joseph H. Davis ( 2004, 2006 ). Using a new and more robust measure of industrial production for the Postbellum period, Davis shows most of the NBER recessions during this time are overstated. In the case of the 1873 downturn it only lasted 2 years. The popular Balke and Gordon (1989) real GNP series for this period similarly shows only a 2-year recession following the 1873 economic downturn while the famous Romer (1989) real GNP series shows no recession at all during this time. Unfortunately, the NBER has not revised these dates and, as a result, it continues to add confusion.
The figure below shows the log version of these three series for the Postbellum period. Nowhere in this figure is there 5 year + economic downturn in the 1870s. (Click on figure to enlarge.)


Update: Commentator ECB points us to this interesting NY Times piece on the 1870s.

Will the Fed Bring Back M3?

Is the M3 money supply making a comeback? It seems to be gaining attention as Bloomberg, the FT Alphaville, and now Ambrose Evans-Pritchard are discussing the deflationary implications of the dramatic slide in the M3 money supply over the past year. I am not as concerned about deflation as they are, but am sympathetic to their view that M3 is currently a better measure of the U.S. money supply than M1 or M2.* I believe this argument was first made by Gary Gorton in his research on the financial crisis. He makes the case for M3 by noting that an accurate measure of the money supply today should include repurchase agreements (which are not in M1 and M2) because (1) they too are bank liabilities used as money and (2) they have grown increasingly important:
[T]he bank liabilities that we will focus on are actually very old, but have not been quantitatively important historically. The liabilities of interest are sale and repurchase agreements, called the “repo” market. Before the crisis trillions of dollars were traded in the repo market. The market was a very liquid market like another very liquid market, the one where goods are exchanged for checks (demand deposits). Repo and checks are both forms of money...

[...]

Repo is money. It was counted in M3 by the Federal Reserve System, until M3 was discontinued in 2006. But, like other privately‐created bank money, it is vulnerable to a shock, which may cause depositors to rationally withdraw en masse, an event which the banking system – in this case the shadow banking system—cannot withstand alone...
This reasoning makes sense to me. The big problem, however, with M3 is that it is no longer published by the Fed. Thus, there are only private sector estimates of M3 and no one knows how accurate they are. I wonder if the Fed is reconsidering its decision to abandon M3. Surely they are aware of Gorton's research and its implications for the conduct of U.S. monetary policy. And surely they can no longer stand by their original cost-concern justification for ceasing the publication of M3:
M3 does not appear to convey any additional information about economic activity that is not already embodied in M2 and has not played a role in the monetary policy process for many years. Consequently, the Board judged that the costs of collecting the underlying data and publishing M3 outweigh the benefits.
To be clear, though, I am not advocating a monetarist position here. I still think monetary policy should aim to stabilize aggregate demand (i.e. implement some kind of a nominal income target) and could do so effectively if it (1) had the will and (2) had a nominal GDP futures market to help guide its decisions.

HT to Josh Hendrickson

*An even better measure of the money supply would be a M3 monetary divisia measure.


Tuesday, May 25, 2010

If Only There Were a Nominal GDP Futures Market...

Ryan Avent suggests I may have been a bit rash in concluding there is no need to be alarmed about the future path of U.S. aggregate demand. He notes that despite the evidence I show, global financial markets--which are forward looking--have been weakening during the past month for good reasons:
On Monday, Christopher Wood took to the pages of the Wall Street Journal to make the case that a double dip recession is a real possibility. He cited the weakening outlook in Europe, the threat that outlook poses to financial markets, a cycle of tightening policy in China, along with the growing deflationary threat and the possibility of a wave of protectionist activity.

To what does all of this amount? Clearly, the outlook for the global economy has worsened in the last month, but by how much? Markets provide some evidence. In America, stocks are still up a good 50% from the lows hit early in 2009. Commodity prices, too, are well above the levels they plumbed during the darkest days of the recession. If the outlook isn't as good as it was in April, it is still considerably better than it was last spring. But this grows less encouraging as markets continue to fall.

The evidence I showed were various proxies for current aggregate demand and a consensus forecast for aggregate demand over the next year. They all pointed up. I also showed the sharp productivity gains which should account for the deflationary pressures. For me, this data clearly says the deflation concerns arising from the April CPI report are misplaced. But here is the rub: all of my evidence goes only through April. Ryan is looking at more recent market data which does paint a bleaker outlook. Too bad we don't have a nominal GDP futures market to shed light on these developments.

Monday, May 24, 2010

More Aggregate Demand Weakness?

The wailing and gnashing of teeth over deflation has begun anew. With the CPI showing a decline in April, folks like Paul Krugman and Greg Ip are concerned about a Japanese-style deflation emerging in the United States. Other observers like Tim Duy and Scott Sumner are similarly concerned as they fear U.S. aggregate demand is going to get increasingly weak. I do not mean to be a contrarian here, but I am having a hard time seeing how these concerns are justified. Yes, the U.S. economy has been plagued by a weak recovery, but the image one gets from this discussion is that we are standing on the precipice of another collapse in spending. If so, the data sure don't show it. Take, for example, monthly retail sales. It grew at a year-on-year rate of almost 10% in April as can be seen in the figure below. The figure also shows domestic demand through 2010:Q1. Given the strong correlation between these two series, it seems likely that the strong growth in current retail sales will also be seen in domestic demand once the numbers are released.(Click on figure to enlarge.)


Of course, the above figure only shows current values. It is possible that the current growth in demand may not be sustained. But that is not what the consensus forecast says. Below is a figure constructed from the Philadelphia Fed's quartely Survey of Professional Forecasters. This figure shows the recently released average forecast for nominal GDP (NGDP) for the period 2010:Q2-2011:Q2. No sign of an expected aggregate demand collapse here. (Click on figure to enlarge.)


In short, these figures shows that both current and expected spending are growing. It may be not be growing as fast as we want, but it is growing and there is no sign of an imminent collapse. Now if aggregate demand is growing and is expected to grow how is it possible to have inflation falling? The simple answer is that aggregate supply must be growing as well. This understanding finds support in the following figure which shows the year-on-year growth rate of labor productivity. Notice the large spike in the productivity growth rate starting in 2009:Q4 (Click on figure to enlarge.)


As I noted in my previous post, this spike in the productivity growth rate may be why the unemployment rate has been remained so high. If, in fact, this productivity surge is the cause of the downward price pressures then here is another case that illustrates why it is important to distinguish between deflationary pressures arising from a negative aggregate demand shock versus those coming from positive aggregate supply shocks. I have written about the importance of this issue before, especially with regards to the 2003 deflation scare.

Thursday, May 13, 2010

Is the High Unemployment Cyclical, Structural, or Both?

One of the remarkable features of the U.S. recession has been the dramatic collapse in demand. This collapse has yet to fully recover, but progress is being made as can be seen in the following figure. This figure shows the year-on-year growth rate of U.S. domestic demand (click on figure to enlarge):


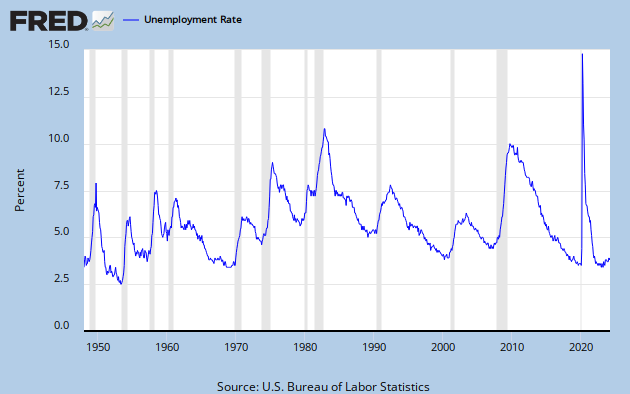
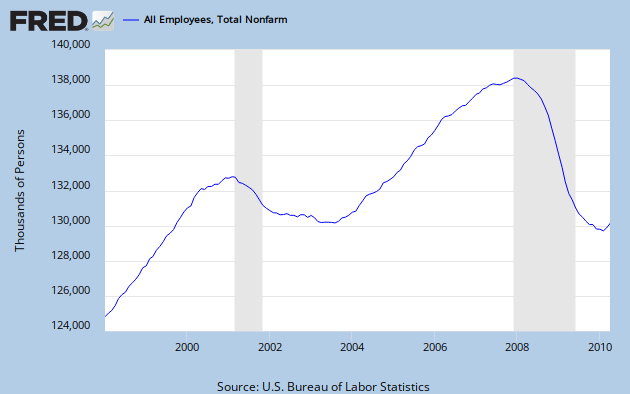
Given this modest recovery in demand one would think there would be a similar recovery in the labor market. But alas, unemployment remains stuck near 10% and the level of employment is where it was back in1999. Some observers are now wondering if more than demand is behind this lack of recovery in labor markets. Ryan Avent, for example, makes this point in a recent article in The Economist:
Were demand all that mattered, employment would be stronger. But its weakness, taken with the divergence of hiring and vacancies, suggests that other explanations are needed. It looks increasingly likely that America’s labour market has developed structural problems that may explain why it is struggling to respond.
Others making this argument include Tyler Cowen and Arnold Kling. Their bottom line is that in this current recession there is limit to what stabilizing demand--my preferred goal for monetary policy--can do for unemployment. In short, not all of the unemployment may be cyclical, some of it may also be structural. This point was further advanced a few days ago by Catherine Rampell in a New York Times piece. Among other things, Rampell brought up the fact that the rapid productivity gains occurring now imply more structural unemployment:
Pruning relatively less-efficient employees like clerks and travel agents, whose work can be done more cheaply by computers or workers abroad, makes American businesses more efficient. Year over year, productivity growth was at its highest level in over 50 years last quarter, pushing corporate profits to record highs and helping the economy grow...

Millions of workers who have already been unemployed for months, if not years, will most likely remain that way even as the overall job market continues to improve, economists say. The occupations they worked in, and the skills they currently possess, are never coming back in style. And the demand for new types of skills moves a lot more quickly than workers — especially older and less mobile workers — are able to retrain and gain those skills.

Now there are other developments besides productivity gains that may be increasing structural unemployment. For example, Ryan Avent points out that this recession has had an inordinate impact on employment in certain industries like construction and many households cannot move to find work because they are underwater with their mortgages. I want to focus, however, on Rampell's point that productivity gains may be creating more structural unemployment. If true it would require significant economy-wide productivity gains. So is there any evidence of this? Below is a figure of the year-on-year labor productivity growth rate (click on figure to enlarge):

The acceleration of the labor productivity growth rate over the last few quarters is striking and consistent with Rampell's story. A more thorough measure, though, of productivity is total factor productivity (TFP) which the BLS only puts out on an annual basis. Fortunately, John Fernald of the San Francisco Fed has a paper where he constructs quarterly a TFP series as well as a utilization-adjusted (i.e. cyclically adjusted) quarterly TFP series. Unlike labor productivity which goes through 2010:Q1, the TFP data only goes through 2009:Q3. Still, an interesting picture emerges as seen in the figure below which graphs this data (click on figure to enlarge):

Overall TFP declined in the recession and has slightly recovered through 2009:Q3. It will be interesting to see if TFP recovers as rapidly as labor productivity in the subsequent quarters. My guess is that it will given the dramatic increase in utilization-adjusted TFP. Of course, this spike may be a one-time blip rather than a sustained increase. And unlike the productivity boom of 2001-2004, I don't know of any good stories for this spike in productivity. Still, it appears to be happening and this implies there may be more structural unemployment.

Given that there is structural unemployment, traditional unemployment benefits will not be a long-term solution. As Rampell notes,
There is no easy policy solution for helping the people left behind. The usual unemployment measures — like jobless benefits and food stamps — can serve as temporary palliatives, but they cannot make workers’ skills relevant again.
What can be done for these folks? Adam Ozimek proposes creating unemployment benefits that address structural unemployment:
So what policies could we pass to make the unemployed better off and incentive them in a way that speeds up the structural unemployment adjustment process? One idea is relocation vouchers. If you offer relocation vouchers to unemployed workers who move a minimum distance from their current residence, then you could incentivize labor to move where it is needed away from where it is no longer needed.
This is an interesting idea and Ozimek provides further discussion on how to finance it. Since the evidence seems to point to increased structural unemployment it is worth rethinking how we do unemployment benefits.

Update: John Fernald along with Susanto Basu and Miles Kimball have a 2006 AER article titled "Are Technology Improvements Contractionary?" Here is the abstract:
Yes. We construct a measure of aggregate technology change, controlling for aggregation effects, varying utilization of capital and labor, nonconstant returns, and imperfect competition. On impact, when technology improves, input use and nonresidential investment fall sharply. Output changes little. With a lag of several years, inputs and investment return to normal and output rises strongly. The standard one-sector real-business-cycle model is not consistent with this evidence. The evidence is consistent, however, with simple sticky-price models, which predict the results we find: when technology improves, inputs and investment generally fall in the short run, and output itself may also fall.
Technology here is analogous to TFP. This study, therefore, provides another reason to believe the rapid productivity gains of late may be creating structural unemployment.

Monday, May 10, 2010

Unfair, But Hilarious

The First Step Toward a Euro Treasury?

So the Eurozone is getting its $ 1 trillion "shock and awe" rescue package and markets are responding with enthusiasm. There has been a lot of discussion about this package, but one potential implication of this plan that has received little attention is that it may put in motion the beginnings of a Euro treasury market. Among other things, the plan calls for the creation of special purpose vehicle that will be able to raise up to $440 billion by issuing debt backed by the Eurozone countries. This description sounds to me a lot like a centralized fiscal authority for the Eurozone. Yes, it has been given only a three-year life, but once folks see that this entity is essentially a Eurozone Treasury it could morph into something more permanent--especially if it plays a key role in preserving the monetary union. And if that happens, a Euro treasury market will emerge that could provide stiff competition to the U.S. treasury market. Moreover, should there arise a Euro Treasury then the Eurozone will have eliminated a key barrier that prevents it from being an optimal currency area.

Update: Ambrose Evans-Pritchard sees the same implications:
[T]he accord profoundly alters the character of the European Union. The walls of fiscal and economic sovereignty are being breached. The creation of an EU rescue mechanism with powers to issue bonds with Europe's AAA rating to help eurozone states in trouble -- apparently €60bn, with a separate facility that may be able to lever up to €500bn -- is to go far beyond the Lisbon Treaty. This new agency is an EU Treasury in all but name, managing an EU fiscal union where liabilities become shared. A European state is being created before our eyes.

Friday, May 7, 2010

Krugman, Mankiw, and the U.S. as an OCA

Paul Krugman has an interesting column today where explains the Greece and Eurozone crisis from the optimal currency area (OCA) framework. Greg Mankiw also likes the OCA framework, but takes issue with Krugman's emphasis on the lack of a centralized fiscal authority as the key reason why the Eurozone is a mess:
A large part of [Krugman's] argument is that Europe is not an optimal currency area because it lacks a large central government enacting transfer payments among the various regions... Is that right? I am not so sure. The United States in the 19th century had a common currency, but it did not have a large, centralized fiscal authority. The federal government was much smaller than it is today. In some ways, the U.S. then looks like Europe today. Yet the common currency among the states worked out fine.
Mankiw attributes the success of the U.S. currency union in the 19th century to wage flexibility and labor mobility. He notes, though, that Greece and much of the Eurozone lack these and thus the Euro experiment may be doomed. I agree with Mankiw that the Eurozone problems are more than just the lack of a centralized fiscal authority. As I have shown before, members of a currency union should (1) share similar business cycles or (2) have in place some combination of economic shock absorbers including flexible wages and prices, factor mobility, fiscal transfers, and diversified economies. Having similar business cycles among the members of a currency union means a common monetary policy, which targets the aggregate business cycle, will be stabilizing for all regions. If, however, there are dissimilar business cycles among the regions then a common monetary policy will be destabilizing—it will be either too stimulative or too tight—for regions unless they have in place some of the economic shock absorbers. Here is how I represented this understanding graphically:

Using this framework I showed that Greece lies inside the OCA boundary. That is, there is not enough of either business cycle similarity or shock absorbers in Greece to justify the cost of its membership in the Eurozone. This is the point Mankiw is making--a number of factors not just lack of meaningful fiscal transfers is why Greece and other countries in the Eurozone may abandon the Euro.

Mankiw's claim, however, that the U.S. currency was an optimal currency area in the 19th century is less convincing. In terms of labor mobility, Gavin Wright has shown that South was an almost entirely separate labor market up until the 1930s-1940s. There was very little labor movement going into and out of the South up until New Deal programs and World War II spending opened up the region. Thus, the cost of the South's membership in the U.S. currency union may have exceeded the benefit up until the latter half of the 20th century. Interestingly, Hugh Rockoff makes the case the U.S. economy did not become an OCA until the 1930s!

I will go one further in this debate. It is not clear to me even now that all of the United States is an OCA. Do we really think Michigan and Texas over the past decade or so benefited from the same monetary policy? And do we think both states had an adequate amount of economic shock absorbers? Given the vast differences between these two states in their business cycles, diversification of industry, union influence, and wage stickiness it easy to wonder whether these states should belong to the same currency union. Yes, they have access to fiscal transfers, labor mobility is great (I myself left a job in Michigan for this one in Texas), culturally they are similar, and politically there is will for the dollar union. Still, given the disparate impact of U.S. monetary policy on different regions of the country one does wonder whether all the United States is truly an OCA.

Update: See Ryan Avent, Paul Krugman, JJ Rosa, and Urbanomics for replies to this post.

Tuesday, May 4, 2010

The Latest Fed Smackdowns

Here are the latest critiques of Fed policy in the early-to-mid 2000s. First up is Roger Lowenstein:
[A]s it still does today, the Fed continued to concentrate on inflation in consumer goods such as cars and computers while all but ignoring speculation in investment assets.

By focusing so zealously on inflation, the Federal Reserve is essentially fighting the last war. The United States' most recent bout of serious inflation occurred in the 1970s and early '80s; in response, then-Fed Chairman Paul Volcker moved aggressively to raise rates in order to curb prices. Since then, asset bubbles have been inflating and popping ever more often.

Excesses that in the past would have produced inflation now cycle back into the economy through the financial markets.
It sounds like Lowenstein has been reading some of William White's work, maybe even his classic "Is Price Stability Enough?" My own answer to White's question is no, price stability is not enough. As I have said before, the Fed's focus should not be on stabilizing inflation but on stabilizing aggregate demand. Given current institutional arrangements, I would also like to see some form of macroprudential policies implemented as well. After all, the period of the Great Moderation was one with relatively stable aggregate demand growth but still experienced unsustainable expansions of credit and debt.

Next up is Barry Ritholtz. I am not sure what motivated this outburst today at the Big Picture, but I liked it:
I Direct Your Attention, Mr. Fed Chairman, to Exhibits 1 through 10:

1. Ultra low interest rates led to a scramble for yield by fund managers;

2. Not coincidentally, there was a massive push into subprime lending by unregulated NONBANKS who existed solely to sell these mortgages to securitizers;

3. Since they were writing mortgages for resale (and held them only briefly) these non-bank lenders collapsed their lending standards; this allowed them to write many more mortgages;

4. These poorly underwritten loans — essentially junk paper — was sold to Wall Street for securitization in huge numbers.

5. Massive ratings fraud of these securities by Fitch, Moody’s and S&P led to a rating of this junk as TripleAAA.

6. That investment grade rating of junk paper allowed those scrambling bond managers (see #1) to purchase higher yield paper that they would not otherwise have been able to.

7. Increased leverage of investment houses allowed a huge securitization manufacturing process; Some iBanks also purchased this paper in enormous numbers;

8. More leverage took place in the shadow derivatives market. That allowed firms like AIG to write $3 trillion in derivative exposure, much of it in mortgage and credit related areas.

9. Compensation packages in the financial sector were asymmetrical, where employees had huge upside but shareholders (and eventually taxpayers) had huge downside. This (logically) led to increasingly aggressive and risky activity.

10. Once home prices began to fall, all of the above fell apart.

I hate having to repeat myself, but it is apparently, necessary.

Well said Barry!

The Threat of Euro Contagion

Nelson D. Schwartz had a great piece in the New York Times a few days ago that showed how susceptible the entire Eurozone would be to a Greek default. Here are the key paragraphs:
The first domino is Greece. It owes nearly $10 billion to Portuguese banks, and with Portugal already falling two notches in S. & P.’s ratings and facing higher borrowing costs, a default by Greece would be a staggering blow. Portugal, in turn, owes $86 billion to banks in Spain; Spain’s debt was downgraded one notch last week.

The numbers quickly mount. Ireland is heavily indebted to Germany and Britain. The exposure of German banks to Spanish debt totals $238 billion, according to the Bank for International Settlements, while French banks hold another $220 billion. And Italy, whose finances are perennially shaky, is owed $31 billion by Spain and owes France $511 billion, or nearly 20 percent of the French gross domestic product.

“This is not a bailout of Greece,” said Eric Fine, who manages Van Eck G-175 Strategies, a hedge fund specializing in currencies and emerging market debt. “This is a bailout of the euro system.”

Read the rest of the article here and check out the cool graphic showing the debt linkages here.

Monday, May 3, 2010

Is the Fed's Long-Run Inflation Target 2.5%?

Karl Smith is thinking about inflation forecasts and directs us to the figure below. Here the daily nominal interest rate on 10 year treasury securities is graphed along with the daily real interest rate on 10-year Treasury inflation-protected securities (TIPS) :


Karl notes the difference between the two series is the bond market's 10-year forecast of inflation and currently it is about 2.5%. Interestingly, outside the financial crisis the forecast value is on average close to this 2.5% value. This can be seen more easily by plotting the difference between the two series as is done in this figure:


This caught my attention because if one goes and looks at the quarterly forecast for the average annual CPI inflation rate over the next 10 years in the Philadelphia Fed's Survey of Professional Forecasters the value is also around 2.5%. Here is the forecast data:

The similarity of inflation forecasts from the bond market and the survey is remarkable.* Even more remarkable is that this long-run value of 2.5% has persisted since the late 1990s and has not been seriously affected by the crisis. It suggests that this value is the Fed's long-run inflation target. As I have said before, the stability of this value attests to the Fed's inflation-fighting credibility. Bond markets, apparently, see no unanchoring of inflation in the future. Of course, this stability of the long-run inflation target also lends support to the view that the Fed was been too tight with monetary policy over the last year and half or so. And on the flip side such a rigid long-run inflation target may also present problems when there are sustained productivity gains.

Update: Peter N. Ireland sheds some light on the Fed's target inflation rate.

*Yes, there is a big difference between the two series during the financial crisis, but much of that may be due to the sharp rise in the liquidity premium on TIPS during this time. Also, the bond market data is daily while the survey is quarterly so some of the day-to-day variation is lost in averaging for the survey.

Greece: Deja Vu Argentia 2001-2002?

The $146 billion rescue package for Greece over the weekend has given some folks hope that Greece and the Eurozone more broadly will survive in their current form. For these folks, this is the needed "shock and awe" package that will save the day. But is it? Peter Boone and Simon Johnson argue that to save the Eurozone not only are funds needed for Greece but also for Italy, Portugal and Spain over a three-year period. They estimate that such a package at a minimum would be around $1 trillion. Other observers are concerned about whether Greece can truly impose the savage austerity on the Greek people that is required by the bailout package. Here is Charles Wyplosz at Vox:
The plan will not work. Greece is supposed to reduce its deficit by 11% of GDP in three years. This would have been a tall order of requirement if the recovery was going to be strong. The drop in public spending, along with the psychological impact of the crisis, will provoke a profound recession that will deepen the deficit. This, along with the social and political impact of the crisis, will undoubtedly prevent the Greek government from delivering on its commitments.
This is beginning to sound a lot like Argentina in late 2001. It too had a sovereign debt problem, an overvalued real exchange rate, and was effectively part of a currency union (via a currency board) that did not meet the optimal currency area criteria. It also tried to cut wages and prices but found the deflationary price too high. Argentina ultimately defaulted on its debt in December 2001 which was just a few months after receiving a second IMF rescue package in August! In retrospect this second bailout from the IMF looks misguided--it only pushed back the inevitable default a few months but added more debt to the country. After defaulting in December 2001, the government of Argentina broke the the peso-dollar link in January 2002. It seems like, then, the Greek crisis is playing out just as it did in Argentina in 2001-2002. Of course, the implications are far bigger here: the crack up of the Eurozone versus the ending of the peso-dollar link for Argentina.

P.S. One of the best reads of the Argentinian crisis is Paul Blustein's "And the Money Kept Rolling In (And Out)." Blustein also had an enjoyable book on the emerging market crises of the late 1990s titled "The Chastening:Inside the Crisis the Rocked the Global Financial System and Humbled the IMF." Both of these books are informed but accessible to a wide audience. I hope he can find time to write a book on this current crisis. It would be a great public service.

Update: Martin Feldstein says Greece will default.

Update II: Maybe Paul Krugman is reading this blog.